Spatial modeling of pesticides
concentrations and pools
concentrations and pools
According to map of spatial distribution of DDT and its metabolites we can estimate that the highest concentrations occur in lowlands, especially in agricultural soils. This is an original place of historical application of these pesticides. DDT is very persistent and has low mobility in the environment; this fact results in relatively low concentrations found in mountains.
Map of concentrations of HCB offers a somewhat different picture than DDT. Increased concentrations are in agricultural soils, but there are also some high levels in mountain areas where this pesticide has never been applied. HCB is more volatile in comparison to DDT and its transport in the environment is more strongly affected by seasonal temperature changes. Final distribution pattern is a result of long-term effect of volatilisation-air transport-deposition processes.
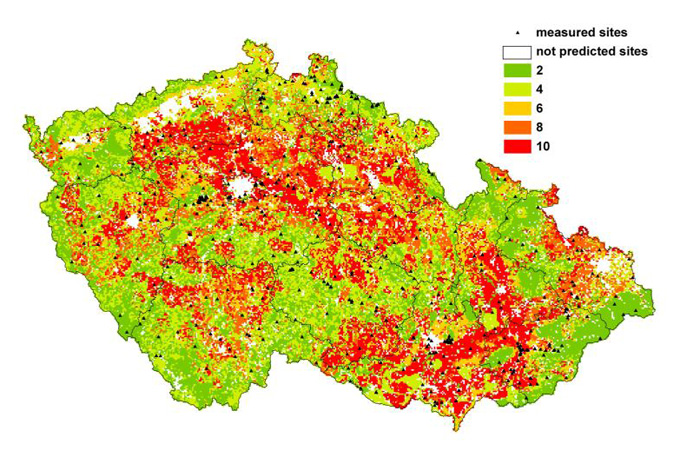
Spatially resolved (grid of 1×1 km) pools of DDT(kg/km2)
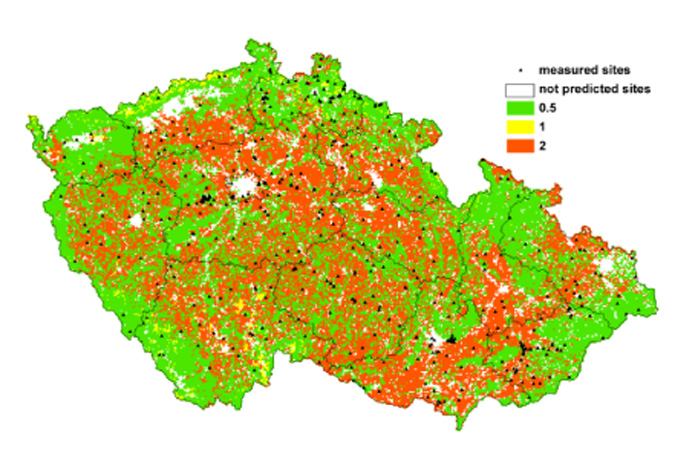
Spatially resolved (grid of 1×1 km) pools of HCB (kg/km2)